Baby Percentile Calculator
Weight, length or head circumference against WHO's growth standards, for your baby's exact age in days.
The tool
Want this in your pocket? Get the iOS app:


WHO percentile tables, birth to 24 months
These are the values on WHO's growth charts at the five curves the charts draw — the 3rd, 15th, 50th, 85th and 97th percentiles — for every month from birth to 24 months. Find your baby's age in completed months and read across. A month here is WHO's month: age in days divided by 30.4375.
Weight-for-age (kg)
Weight in kilograms.
Boys
| Month | 3rd | 15th | 50th | 85th | 97th |
|---|---|---|---|---|---|
| Birth | 2.5 | 2.9 | 3.3 | 3.9 | 4.3 |
| 1 | 3.4 | 3.9 | 4.5 | 5.1 | 5.7 |
| 2 | 4.4 | 4.9 | 5.6 | 6.3 | 7.0 |
| 3 | 5.1 | 5.6 | 6.4 | 7.2 | 7.9 |
| 4 | 5.6 | 6.2 | 7.0 | 7.9 | 8.6 |
| 5 | 6.1 | 6.7 | 7.5 | 8.4 | 9.2 |
| 6 | 6.4 | 7.1 | 7.9 | 8.9 | 9.7 |
| 7 | 6.7 | 7.4 | 8.3 | 9.3 | 10.2 |
| 8 | 7.0 | 7.7 | 8.6 | 9.6 | 10.5 |
| 9 | 7.2 | 7.9 | 8.9 | 10.0 | 10.9 |
| 10 | 7.5 | 8.2 | 9.2 | 10.3 | 11.2 |
| 11 | 7.7 | 8.4 | 9.4 | 10.5 | 11.5 |
| 12 | 7.8 | 8.6 | 9.6 | 10.8 | 11.8 |
| 13 | 8.0 | 8.8 | 9.9 | 11.1 | 12.1 |
| 14 | 8.2 | 9.0 | 10.1 | 11.3 | 12.4 |
| 15 | 8.4 | 9.2 | 10.3 | 11.6 | 12.7 |
| 16 | 8.5 | 9.4 | 10.5 | 11.8 | 12.9 |
| 17 | 8.7 | 9.6 | 10.7 | 12.0 | 13.2 |
| 18 | 8.9 | 9.7 | 10.9 | 12.3 | 13.5 |
| 19 | 9.0 | 9.9 | 11.1 | 12.5 | 13.7 |
| 20 | 9.2 | 10.1 | 11.3 | 12.7 | 14.0 |
| 21 | 9.3 | 10.3 | 11.5 | 13.0 | 14.3 |
| 22 | 9.5 | 10.5 | 11.8 | 13.2 | 14.5 |
| 23 | 9.7 | 10.6 | 12.0 | 13.4 | 14.8 |
| 24 | 9.8 | 10.8 | 12.2 | 13.7 | 15.1 |
Girls
| Month | 3rd | 15th | 50th | 85th | 97th |
|---|---|---|---|---|---|
| Birth | 2.4 | 2.8 | 3.2 | 3.7 | 4.2 |
| 1 | 3.2 | 3.6 | 4.2 | 4.8 | 5.4 |
| 2 | 4.0 | 4.5 | 5.1 | 5.9 | 6.5 |
| 3 | 4.6 | 5.1 | 5.8 | 6.7 | 7.4 |
| 4 | 5.1 | 5.6 | 6.4 | 7.3 | 8.1 |
| 5 | 5.5 | 6.1 | 6.9 | 7.8 | 8.7 |
| 6 | 5.8 | 6.4 | 7.3 | 8.3 | 9.2 |
| 7 | 6.1 | 6.7 | 7.6 | 8.7 | 9.6 |
| 8 | 6.3 | 7.0 | 7.9 | 9.0 | 10.0 |
| 9 | 6.6 | 7.3 | 8.2 | 9.3 | 10.4 |
| 10 | 6.8 | 7.5 | 8.5 | 9.6 | 10.7 |
| 11 | 7.0 | 7.7 | 8.7 | 9.9 | 11.0 |
| 12 | 7.1 | 7.9 | 8.9 | 10.2 | 11.3 |
| 13 | 7.3 | 8.1 | 9.2 | 10.4 | 11.6 |
| 14 | 7.5 | 8.3 | 9.4 | 10.7 | 11.9 |
| 15 | 7.7 | 8.5 | 9.6 | 10.9 | 12.2 |
| 16 | 7.8 | 8.7 | 9.8 | 11.2 | 12.5 |
| 17 | 8.0 | 8.8 | 10.0 | 11.4 | 12.7 |
| 18 | 8.2 | 9.0 | 10.2 | 11.6 | 13.0 |
| 19 | 8.3 | 9.2 | 10.4 | 11.9 | 13.3 |
| 20 | 8.5 | 9.4 | 10.6 | 12.1 | 13.5 |
| 21 | 8.7 | 9.6 | 10.9 | 12.4 | 13.8 |
| 22 | 8.8 | 9.8 | 11.1 | 12.6 | 14.1 |
| 23 | 9.0 | 9.9 | 11.3 | 12.8 | 14.3 |
| 24 | 9.2 | 10.1 | 11.5 | 13.1 | 14.6 |
Length-for-age (cm)
Length in centimetres, measured lying down — WHO's table is recumbent length from birth to 24 months.
Boys
| Month | 3rd | 15th | 50th | 85th | 97th |
|---|---|---|---|---|---|
| Birth | 46.3 | 47.9 | 49.9 | 51.8 | 53.4 |
| 1 | 51.1 | 52.7 | 54.7 | 56.7 | 58.4 |
| 2 | 54.7 | 56.4 | 58.4 | 60.5 | 62.2 |
| 3 | 57.6 | 59.3 | 61.4 | 63.5 | 65.3 |
| 4 | 60.0 | 61.7 | 63.9 | 66.0 | 67.8 |
| 5 | 61.9 | 63.7 | 65.9 | 68.1 | 69.9 |
| 6 | 63.6 | 65.4 | 67.6 | 69.8 | 71.6 |
| 7 | 65.1 | 66.9 | 69.2 | 71.4 | 73.2 |
| 8 | 66.5 | 68.3 | 70.6 | 72.9 | 74.7 |
| 9 | 67.7 | 69.6 | 72.0 | 74.3 | 76.2 |
| 10 | 69.0 | 70.9 | 73.3 | 75.6 | 77.6 |
| 11 | 70.2 | 72.1 | 74.5 | 77.0 | 78.9 |
| 12 | 71.3 | 73.3 | 75.7 | 78.2 | 80.2 |
| 13 | 72.4 | 74.4 | 76.9 | 79.4 | 81.5 |
| 14 | 73.4 | 75.5 | 78.0 | 80.6 | 82.7 |
| 15 | 74.4 | 76.5 | 79.1 | 81.8 | 83.9 |
| 16 | 75.4 | 77.5 | 80.2 | 82.9 | 85.1 |
| 17 | 76.3 | 78.5 | 81.2 | 84.0 | 86.2 |
| 18 | 77.2 | 79.5 | 82.3 | 85.1 | 87.3 |
| 19 | 78.1 | 80.4 | 83.2 | 86.1 | 88.4 |
| 20 | 78.9 | 81.3 | 84.2 | 87.1 | 89.5 |
| 21 | 79.7 | 82.2 | 85.1 | 88.1 | 90.5 |
| 22 | 80.5 | 83.0 | 86.0 | 89.1 | 91.6 |
| 23 | 81.3 | 83.8 | 86.9 | 90.0 | 92.6 |
| 24 | 82.1 | 84.6 | 87.8 | 91.0 | 93.6 |
Girls
| Month | 3rd | 15th | 50th | 85th | 97th |
|---|---|---|---|---|---|
| Birth | 45.6 | 47.2 | 49.1 | 51.1 | 52.7 |
| 1 | 50.0 | 51.7 | 53.7 | 55.7 | 57.4 |
| 2 | 53.2 | 55.0 | 57.1 | 59.2 | 60.9 |
| 3 | 55.8 | 57.6 | 59.8 | 62.0 | 63.8 |
| 4 | 58.0 | 59.8 | 62.1 | 64.3 | 66.2 |
| 5 | 59.9 | 61.7 | 64.0 | 66.3 | 68.2 |
| 6 | 61.5 | 63.4 | 65.7 | 68.1 | 70.0 |
| 7 | 62.9 | 64.9 | 67.3 | 69.7 | 71.6 |
| 8 | 64.3 | 66.3 | 68.7 | 71.2 | 73.2 |
| 9 | 65.6 | 67.6 | 70.1 | 72.6 | 74.7 |
| 10 | 66.8 | 68.9 | 71.5 | 74.0 | 76.1 |
| 11 | 68.0 | 70.2 | 72.8 | 75.4 | 77.5 |
| 12 | 69.2 | 71.3 | 74.0 | 76.7 | 78.9 |
| 13 | 70.3 | 72.5 | 75.2 | 77.9 | 80.2 |
| 14 | 71.3 | 73.6 | 76.4 | 79.2 | 81.4 |
| 15 | 72.4 | 74.7 | 77.5 | 80.3 | 82.7 |
| 16 | 73.3 | 75.7 | 78.6 | 81.5 | 83.9 |
| 17 | 74.3 | 76.7 | 79.7 | 82.6 | 85.0 |
| 18 | 75.2 | 77.7 | 80.7 | 83.7 | 86.2 |
| 19 | 76.2 | 78.7 | 81.7 | 84.8 | 87.3 |
| 20 | 77.0 | 79.6 | 82.7 | 85.8 | 88.4 |
| 21 | 77.9 | 80.5 | 83.7 | 86.8 | 89.4 |
| 22 | 78.7 | 81.4 | 84.6 | 87.8 | 90.5 |
| 23 | 79.6 | 82.2 | 85.5 | 88.8 | 91.5 |
| 24 | 80.3 | 83.1 | 86.4 | 89.8 | 92.5 |
Head circumference-for-age (cm)
Head circumference in centimetres, around the widest part of the head.
Boys
| Month | 3rd | 15th | 50th | 85th | 97th |
|---|---|---|---|---|---|
| Birth | 32.1 | 33.1 | 34.5 | 35.8 | 36.9 |
| 1 | 35.1 | 36.1 | 37.3 | 38.5 | 39.5 |
| 2 | 36.9 | 37.9 | 39.1 | 40.3 | 41.3 |
| 3 | 38.3 | 39.3 | 40.5 | 41.7 | 42.7 |
| 4 | 39.4 | 40.4 | 41.6 | 42.9 | 43.9 |
| 5 | 40.3 | 41.3 | 42.6 | 43.8 | 44.8 |
| 6 | 41.0 | 42.1 | 43.3 | 44.6 | 45.6 |
| 7 | 41.7 | 42.7 | 44.0 | 45.3 | 46.3 |
| 8 | 42.2 | 43.2 | 44.5 | 45.8 | 46.9 |
| 9 | 42.6 | 43.7 | 45.0 | 46.3 | 47.4 |
| 10 | 43.0 | 44.1 | 45.4 | 46.7 | 47.8 |
| 11 | 43.4 | 44.4 | 45.8 | 47.1 | 48.2 |
| 12 | 43.6 | 44.7 | 46.1 | 47.4 | 48.5 |
| 13 | 43.9 | 45.0 | 46.3 | 47.7 | 48.8 |
| 14 | 44.1 | 45.2 | 46.6 | 47.9 | 49.0 |
| 15 | 44.3 | 45.5 | 46.8 | 48.2 | 49.3 |
| 16 | 44.5 | 45.6 | 47.0 | 48.4 | 49.5 |
| 17 | 44.7 | 45.8 | 47.2 | 48.6 | 49.7 |
| 18 | 44.9 | 46.0 | 47.4 | 48.7 | 49.9 |
| 19 | 45.0 | 46.2 | 47.5 | 48.9 | 50.0 |
| 20 | 45.2 | 46.3 | 47.7 | 49.1 | 50.2 |
| 21 | 45.3 | 46.4 | 47.8 | 49.2 | 50.4 |
| 22 | 45.4 | 46.6 | 48.0 | 49.4 | 50.5 |
| 23 | 45.6 | 46.7 | 48.1 | 49.5 | 50.7 |
| 24 | 45.7 | 46.8 | 48.3 | 49.7 | 50.8 |
Girls
| Month | 3rd | 15th | 50th | 85th | 97th |
|---|---|---|---|---|---|
| Birth | 31.7 | 32.7 | 33.9 | 35.1 | 36.1 |
| 1 | 34.3 | 35.3 | 36.5 | 37.8 | 38.8 |
| 2 | 36.0 | 37.0 | 38.3 | 39.5 | 40.5 |
| 3 | 37.2 | 38.2 | 39.5 | 40.8 | 41.9 |
| 4 | 38.2 | 39.3 | 40.6 | 41.9 | 43.0 |
| 5 | 39.0 | 40.1 | 41.5 | 42.8 | 43.9 |
| 6 | 39.7 | 40.8 | 42.2 | 43.5 | 44.6 |
| 7 | 40.4 | 41.5 | 42.8 | 44.2 | 45.3 |
| 8 | 40.9 | 42.0 | 43.4 | 44.7 | 45.9 |
| 9 | 41.3 | 42.4 | 43.8 | 45.2 | 46.3 |
| 10 | 41.7 | 42.8 | 44.2 | 45.6 | 46.8 |
| 11 | 42.0 | 43.2 | 44.6 | 46.0 | 47.1 |
| 12 | 42.3 | 43.5 | 44.9 | 46.3 | 47.5 |
| 13 | 42.6 | 43.8 | 45.2 | 46.6 | 47.7 |
| 14 | 42.9 | 44.0 | 45.4 | 46.8 | 48.0 |
| 15 | 43.1 | 44.2 | 45.7 | 47.1 | 48.2 |
| 16 | 43.3 | 44.4 | 45.9 | 47.3 | 48.5 |
| 17 | 43.5 | 44.6 | 46.1 | 47.5 | 48.7 |
| 18 | 43.6 | 44.8 | 46.2 | 47.7 | 48.8 |
| 19 | 43.8 | 45.0 | 46.4 | 47.8 | 49.0 |
| 20 | 44.0 | 45.1 | 46.6 | 48.0 | 49.2 |
| 21 | 44.1 | 45.3 | 46.7 | 48.2 | 49.4 |
| 22 | 44.3 | 45.4 | 46.9 | 48.3 | 49.5 |
| 23 | 44.4 | 45.6 | 47.0 | 48.5 | 49.7 |
| 24 | 44.6 | 45.7 | 47.2 | 48.6 | 49.8 |
Rounded to one decimal, as WHO prints its tables. The 50th percentile is the median. WHO publishes separate tables for boys and girls and no combined one.
Source: WHO Child Growth Standards (weight and length 2006, head circumference 2007), monthly percentile tables. who.int © World Health Organization.
How this works
Choose what you measured — weight, length or head circumference — and whether your baby is a boy or a girl. WHO publishes separate tables for boys and girls and no combined one, so the calculator does not guess. Then give the age, either as a birth date and the day of the measurement or typed in days, weeks or months, and enter the number in kg or lb and oz, cm or inches. The result appears as you type: the percentile, the z-score behind it, WHO's median and 3rd–97th range for that exact age, and where the measurement sits on WHO's chart.
A percentile is a position, not a grade. On the 30th percentile, about 30 in 100 healthy babies of the same age and sex measure less and 70 measure more. The standards behind it are WHO's: the Multicentre Growth Reference Study followed about 8,500 children in Brazil, Ghana, India, Norway, Oman and the USA, raised in conditions that favour healthy growth, with the breastfed baby as the model. In the US, the CDC recommends these WHO charts from birth to 24 months.
The result also says whether the measurement is inside WHO's typical range. WHO's growth-assessment course says children who are growing normally are generally on or between the −2 and +2 z-score lines, roughly the 2nd to the 98th percentile. Only outside those lines does the calculator suggest talking to your pediatrician, and it names the line. One measurement is a snapshot: home scales differ, a wriggling baby measures short, and what your pediatrician reads is whether your baby keeps following their own curve over several visits.
For a baby born before 37 weeks, choose the week of birth and the calculator scores corrected age, as the ProbaBaby app does. The calculation runs in your browser, and your inputs live in the address bar, so you can bookmark a result or send it to a partner. Below the calculator are WHO's month-by-month tables for all three measurements.
The math behind it
WHO describes each measurement with three numbers for every day of age from birth to 730 days, separately for boys and girls: L (the skew), M (the median) and S (the spread). The z-score is z = ((x ÷ M)^L − 1) ÷ (L × S), or ln(x ÷ M) ÷ S when L is 0. The percentile is the share of a normal distribution below that z: Φ(z) × 100. Length and head circumference have L = 1, which makes them plain normal distributions.
A worked example. A girl measured at 4 months is 4 × 30.4375 = 121.75 days old, which WHO rounds to the day-122 row: L = −0.0053, M = 6.428 kg, S = 0.12401. At 5.2 kg, z = ((5.2 ÷ 6.428)^−0.0053 − 1) ÷ (−0.0053 × 0.12401) = −1.71, and Φ(−1.71) = 4.4%, so she is on the 4th percentile: in the 3rd–15th band, and inside WHO's typical range because −1.71 is above the −2 line.
Weight gets one extra rule. Beyond ±3 SD the LMS curve would produce weights no baby has, so WHO continues in steps the width of the gap between its 2 SD and 3 SD lines — the restricted method in WHO's anthro software. Length and head circumference never need it. A value so extreme that WHO's software flags it as a likely error (weight z below −6 or above 5, length beyond ±6, head beyond ±5) gets a check-the-measurement note instead of advice.
Age is counted in whole days, the way WHO's anthro software counts it: an age typed in months is multiplied by 30.4375 and rounded half up, so a measurement on day 23 is scored against day 23 rather than rounded to a month. For a baby born before 37 weeks, (40 − weeks at birth) × 7 days come off the age first. Before that due-date equivalent WHO has no row, so there is no percentile, and the 0–2 year standards end at day 730.
The percentile is shown as a whole number, with under the 1st and over the 99th in the tails, where more precision would be false. The flag uses WHO's own cut-offs on the z-score shown: below −3, −3 to −2, −2 to +2, +2 to +3 and above +3, and a value exactly on a line counts in the less severe group, as WHO's training course instructs. The chart band (3rd, 15th, 85th, 97th) is for display only: the 3rd percentile is z = −1.88, still inside the typical range. In this site's test suite every score matches WHO's published tables to ±0.01 z, and the tables below match WHO's printed monthly tables cell by cell.
In the ProbaBaby app
iPhone · iPad · Apple WatchFrom one percentile to a growth curve, ready for the pediatrician
This page checks one measurement. The app keeps every measurement and draws them on the WHO curves for your baby's sex, so you see the trend, not a single point.
The app also
- Weight, length and head circumference over time on the WHO P3 to P97 curves.
- Age counted in days, and corrected automatically for a baby born early.
- A Pediatrician Prep PDF with the first year on one axis and a vaccine lane, shareable by QR code (24 hours, one view).
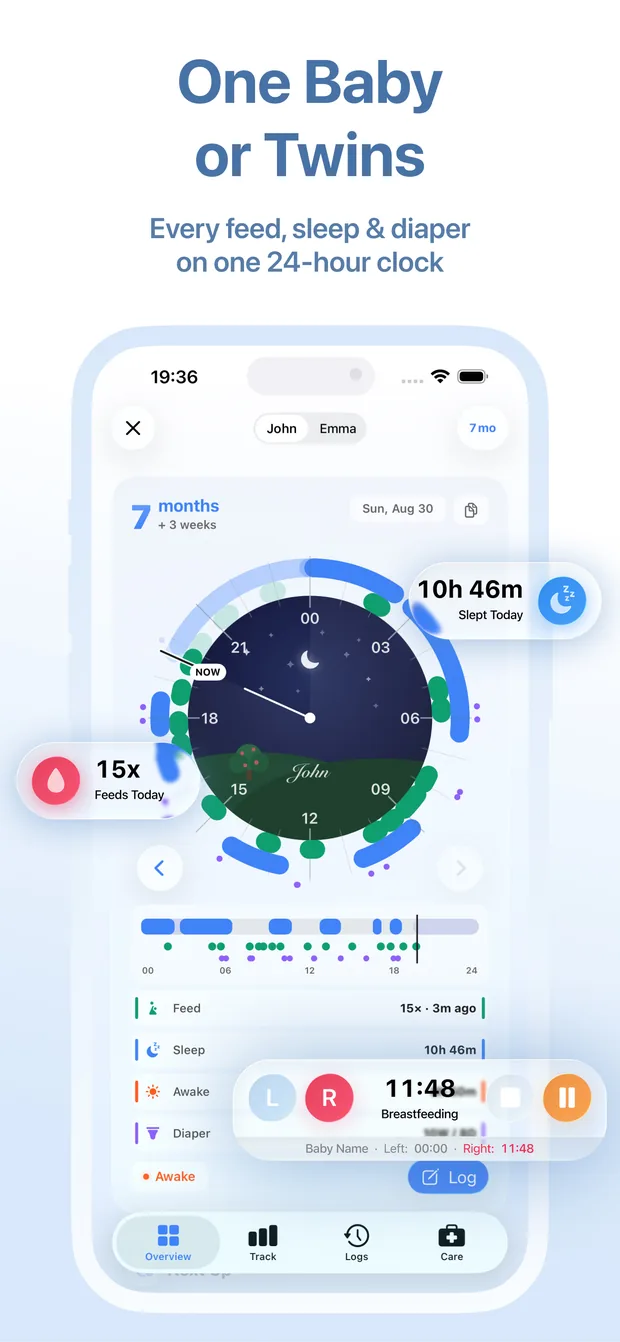
- Feeds, sleep, diapers and 58 milestones in the same baby log, shared with your family in real time.
Free to download and use: pregnancy, baby and mom tracking, 32 tools, PDF reports, widgets, Apple Watch and family sharing cost nothing. Only AI baby predictions use credits.
On the App Store

This page and the app, side by side
| Feature | This page | ProbaBaby app |
|---|---|---|
| Standard | WHO growth standards | The same WHO standards |
| Measurements | One check at a time | Every measurement kept and charted |
| For the checkup | One result on screen | Pediatrician Prep PDF, shared by QR code |
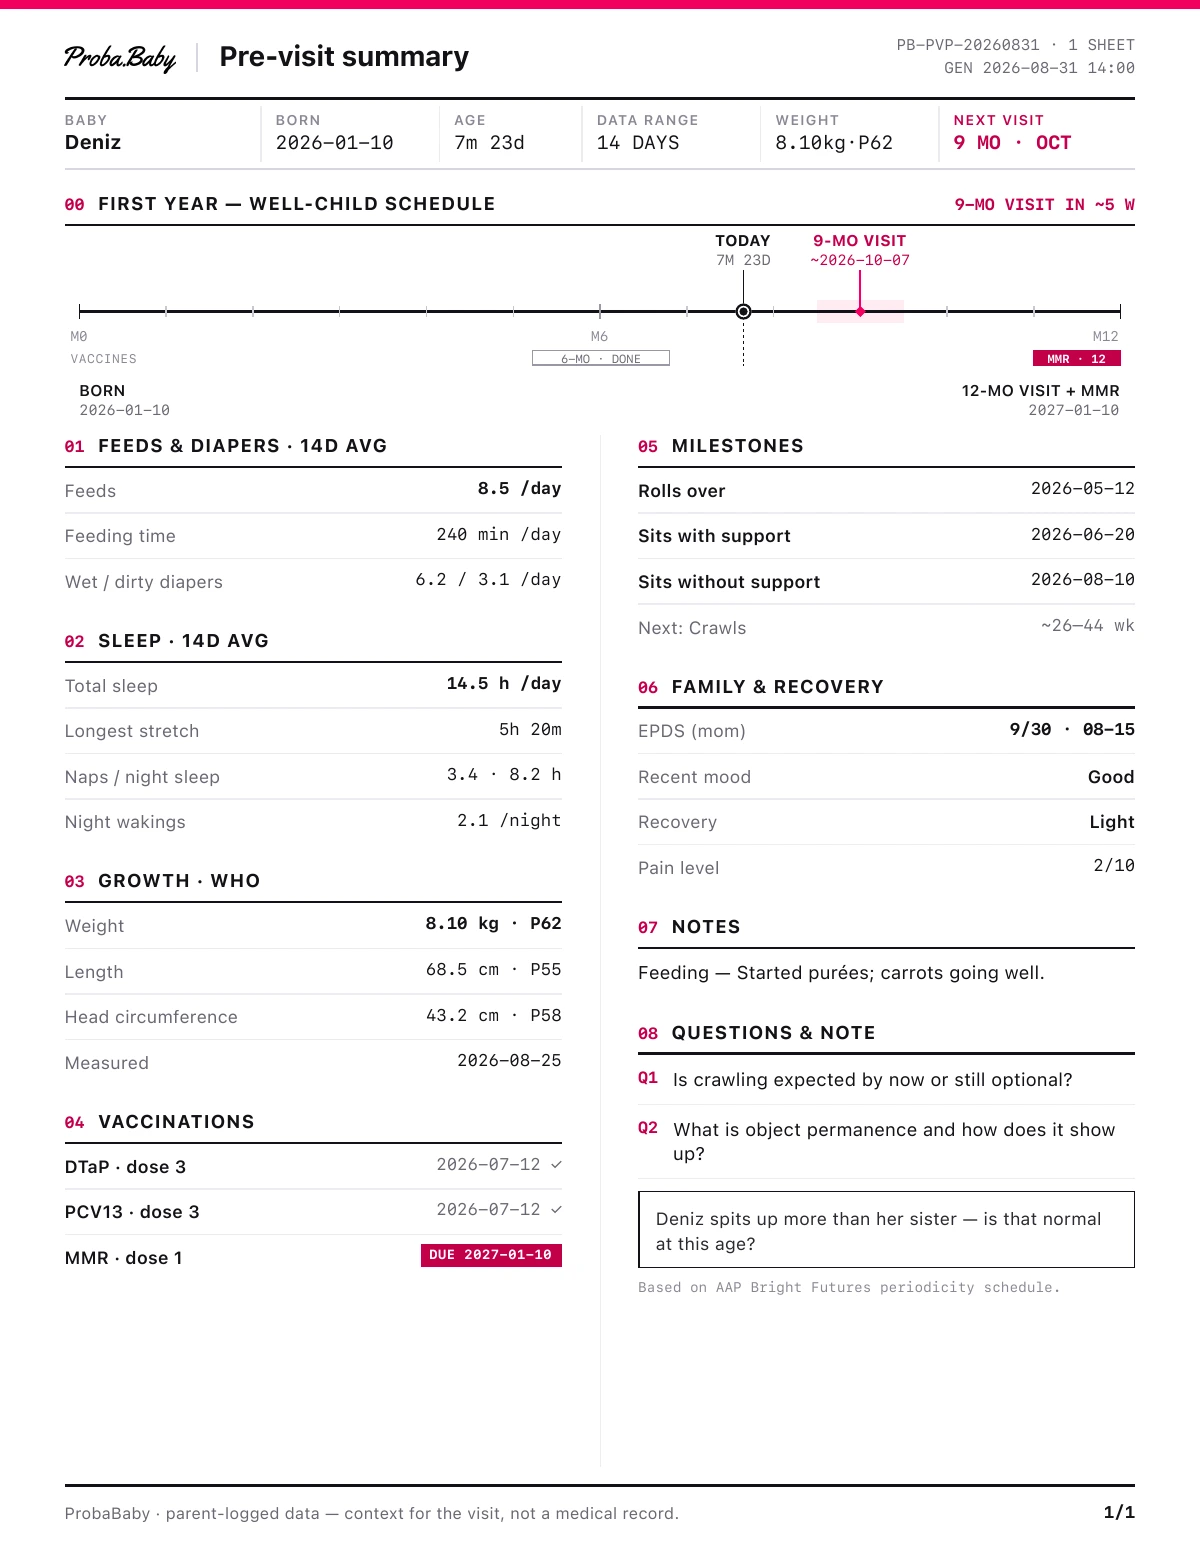
Sheet 1 of 1
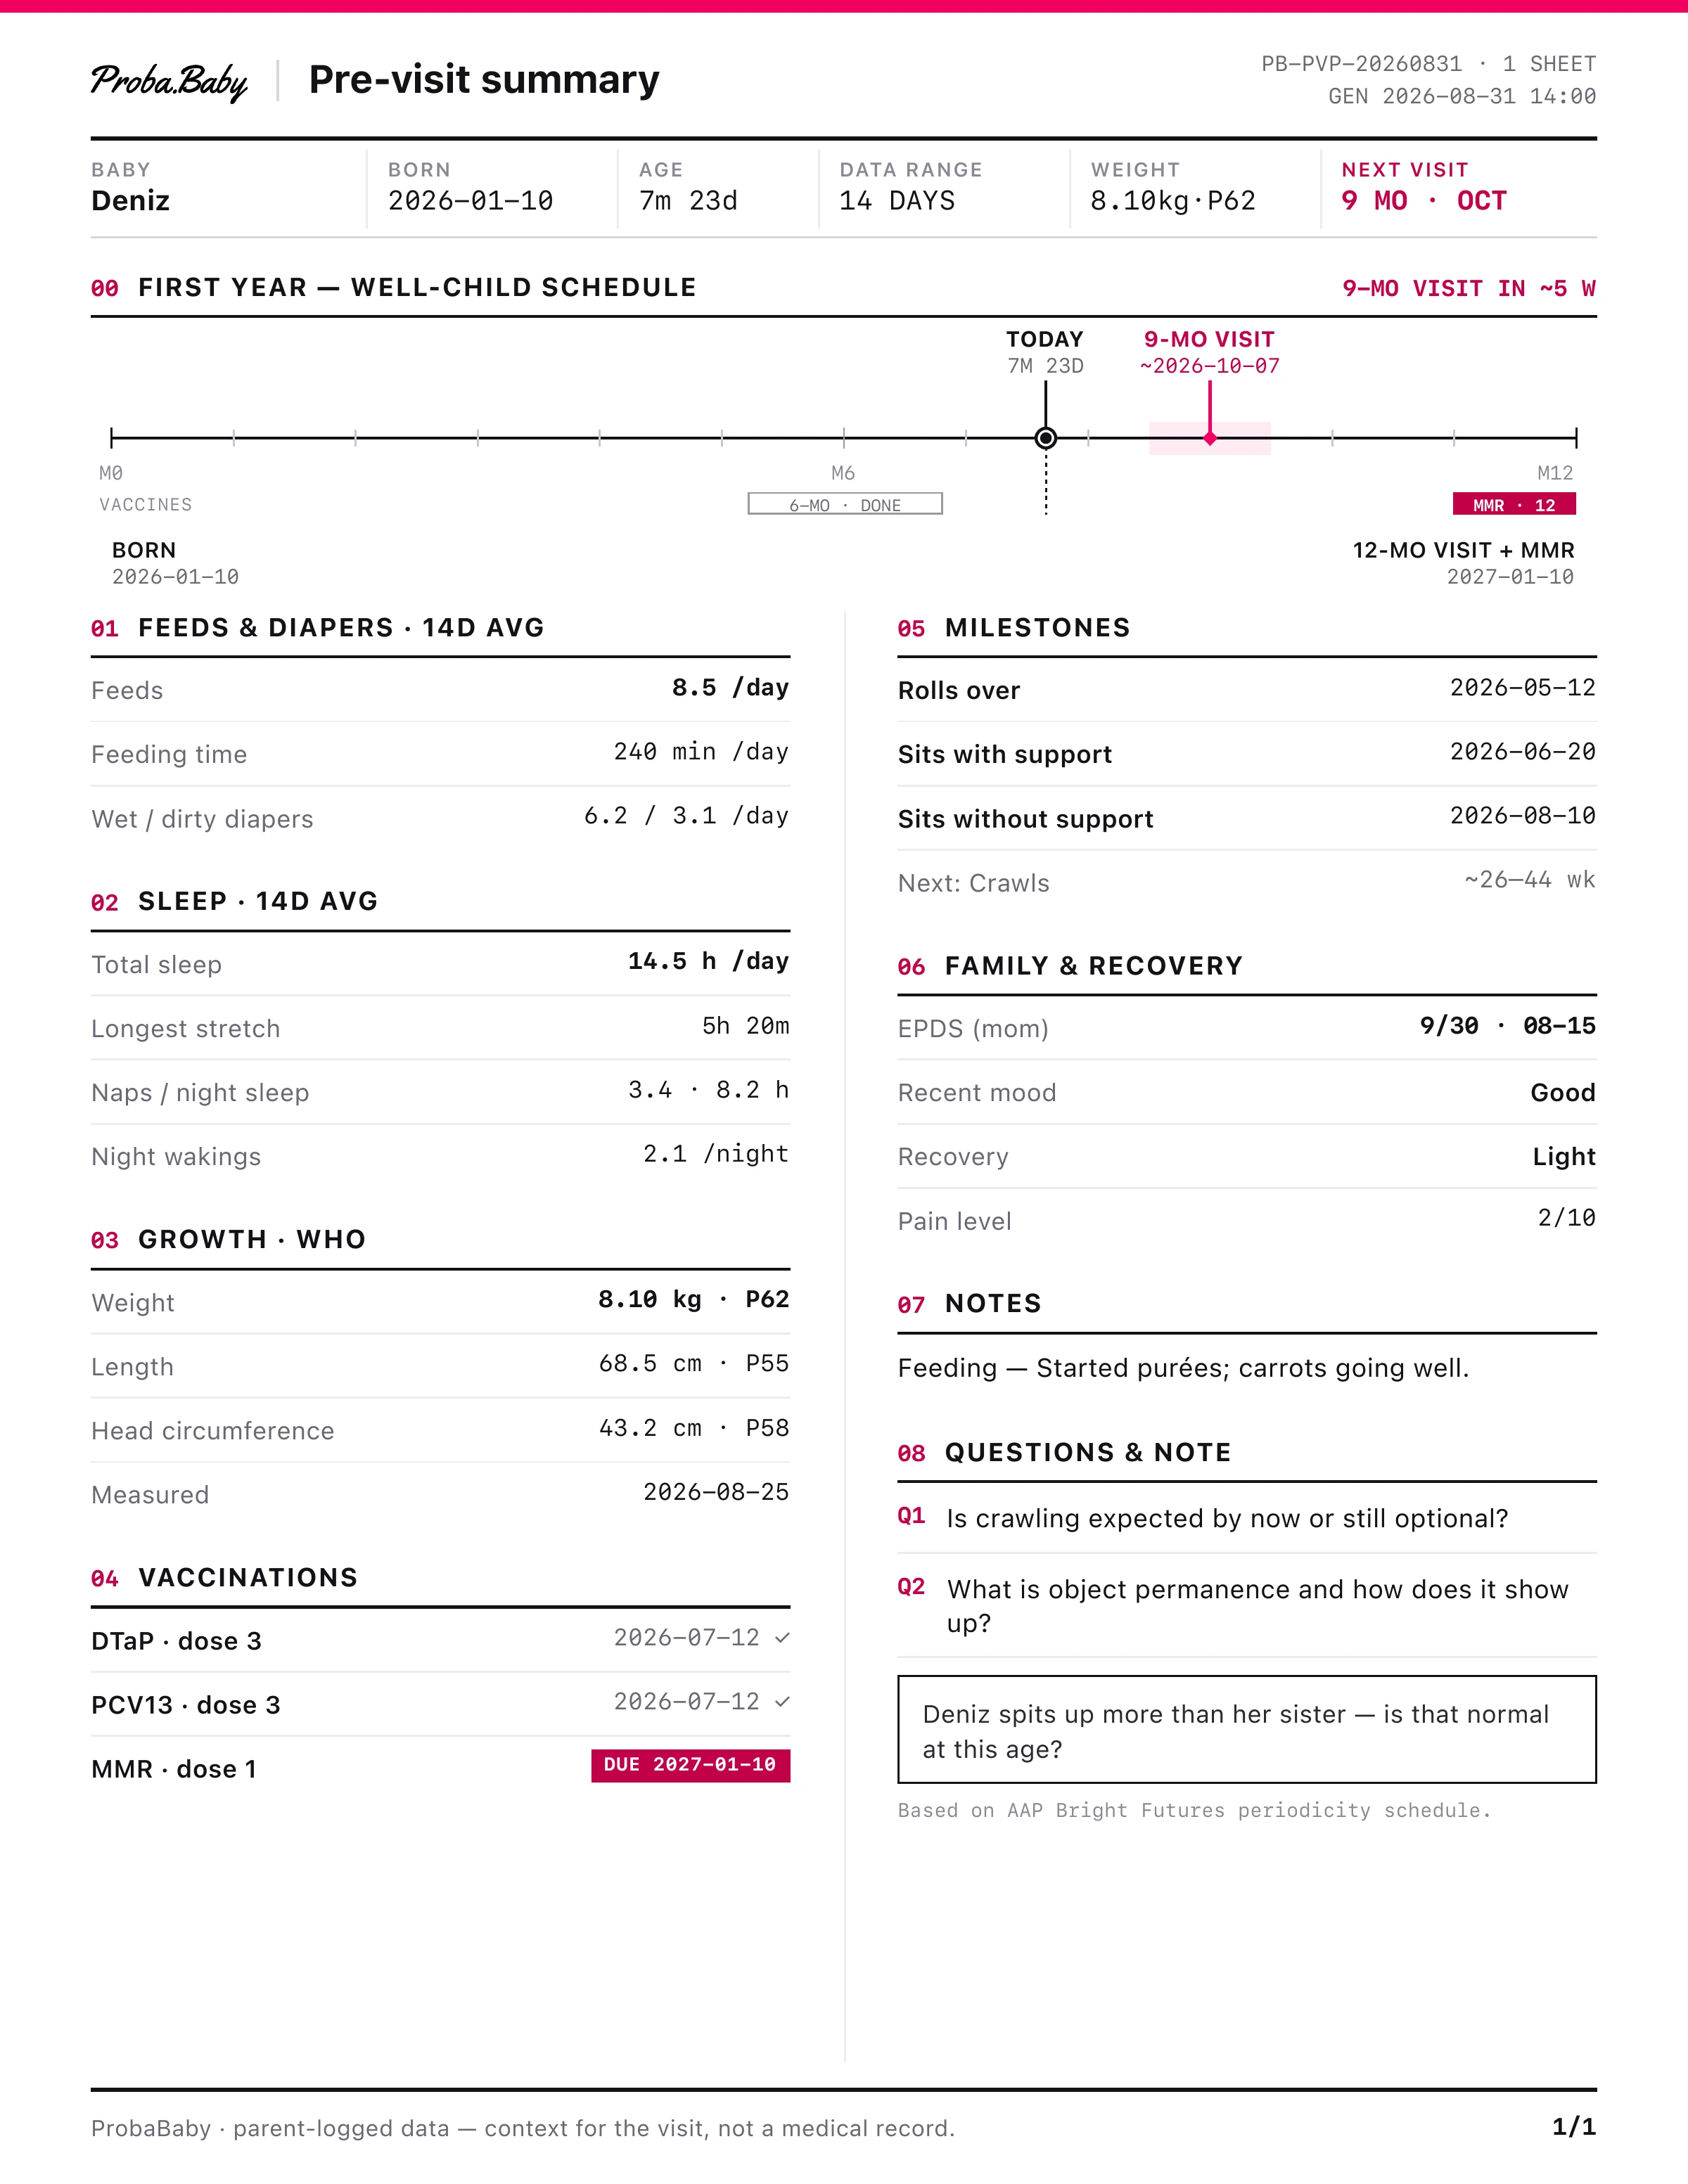
Sample pre-visit summary for the pediatrician: first-year well-child timeline, feeds, sleep, WHO growth percentiles, vaccines, milestones and your questions on one sheet. Fictional baby.
Frequently asked questions
It is where your baby sits among healthy babies of the same age and sex. On the 40th percentile, about 40 in 100 measure less and 60 measure more. It describes size, not health, and half of all healthy babies are below the 50th by definition. What your pediatrician watches is whether your baby keeps roughly to the same curve over time.
WHO's growth-assessment course says children who are growing normally are generally on or between the −2 and +2 z-score lines, roughly the 2nd to the 98th percentile. A baby steadily on the 5th or the 95th can be perfectly well. Outside those lines the calculator suggests talking to your pediatrician, because WHO uses them as cut-offs that deserve a closer look — not because they are a diagnosis.
Boys and girls grow on different curves, and WHO publishes separate tables for each with no combined one. Picking one at random would move the answer by several percentiles, so the calculator, like the ProbaBaby app, asks rather than guesses.
For babies under 2 in the US, yes: the CDC recommends the WHO growth standards from birth to 24 months and its own CDC charts from age 2. On the WHO charts the CDC prints, the −2 and +2 lines are labelled the 2nd and 98th percentiles. This calculator stops at 24 months for the same reason.
Enter the birth date and choose the week your baby was born. Before 37 weeks the calculator subtracts (40 − weeks at birth) × 7 days and scores that corrected age, the method the AAP describes. If you type the age instead, type the corrected age. Before the due-date equivalent there is no WHO percentile, because WHO's curves start at term.
Usually it is the age or the measurement. Clinics often round age to a week or a month, while this calculator uses the exact day, and in the first weeks a few days move the answer noticeably. Scales, clothing and a baby who will not lie straight for length shift the number too. Some countries use their own charts, such as the UK-WHO charts, which are based on the WHO standards.
No. Weight-for-age cannot tell you that, because a long baby weighs more. WHO's growth-assessment course says a high weight-for-age is better judged with weight-for-length or BMI-for-age, which compare weight with length. Check length here too, and ask your pediatrician if both numbers worry you.
This calculator scores one measurement at a time. In the ProbaBaby app, growth percentiles come from WHO's own per-day LMS tables, generated from the WHO anthro package — a measurement on day 23 is scored against day 23 — and each measurement is kept, so you can see the curve. A free account is required to use the app.